
The kilogram of hydrogen displayed at the pump tells only part of the story. Between the public rate, the additional costs associated with operating stations, and price discrepancies based on the customer’s profile, the actual cost of a full tank of hydrogen in 2024 deserves a more granular reading than the averages usually cited.
Operating Costs of Hydrogen Stations and Their Impact on Price per Kilogram
The price displayed at the pump includes a layer of costs that most comparisons overlook. A hydrogen distribution station relies on compressors, high-pressure storage, and distribution at 700 bars with specific safety systems. These facilities generate high fixed costs, largely independent of the volume distributed.
In practice, a station that refuels few vehicles per day amortizes these costs over a small number of kilograms sold. The unit cost mechanically rises. We observe that some stations even experience service interruptions related to this underutilization, further degrading the user experience and the actual cost of use.
An article detailing the price of a full tank of hydrogen in Paris from an airplane’s perspective helps to situate the order of magnitude practiced in Île-de-France. The discrepancies from one station to another can be surprising, even within the same urban area.
The European regulation AFIR provides for a network of publicly accessible stations on the trans-European network, with a maximum distance of 200 km between certain stations by 2030. This requirement will improve geographic coverage, but it does not guarantee the profitability of each distribution point or its permanent availability. The risk of ghost stations, open on paper but closed due to lack of traffic, remains tangible.
Public Rate vs. Fleet Rate: A Rarely Documented Discrepancy
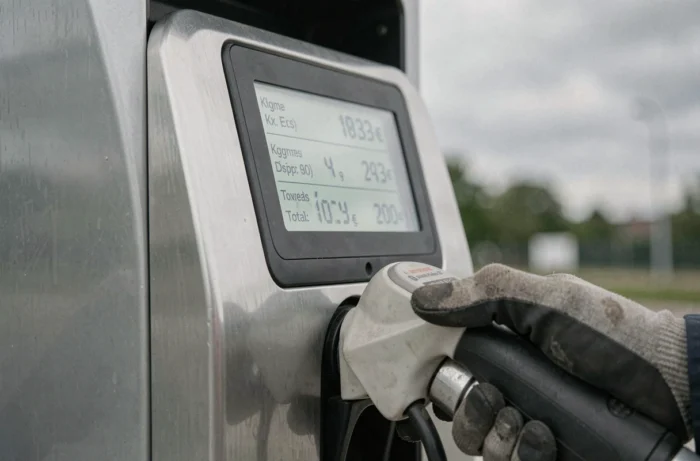
The price per kilogram displayed at the station does not necessarily reflect what the main consumers of mobility hydrogen pay. Station operators frequently offer professional fleets (taxis, municipalities, transport companies) a contractual rate lower than the public price. These conditions are generally unpublished.
This opacity skews comparisons. An individual calculating their fuel budget based on the displayed price will obtain a cost per kilometer significantly higher than a fleet operator benefiting from a negotiated agreement. The delta between the two can reach several euros per kilogram depending on the volume committed and the duration of the contract.
For an individual driving a Toyota Mirai or Hyundai Nexo, the calculation remains penalizing. The tank of these vehicles accepts about five to six kilograms of hydrogen, and the cost of a full tank is comparable to that of a full tank of gasoline for an equivalent thermal vehicle. The economic advantage compared to battery electric vehicles is negligible, or even negative.
Green, Gray, Blue Hydrogen: The Impact of Origin on Pump Price
The color of hydrogen determines both its carbon footprint and its production cost. Gray hydrogen, produced by steam reforming natural gas, remains the cheapest to produce. Green hydrogen, obtained through electrolysis powered by renewable energy, costs significantly more.
At the station, this distinction is rarely reflected in a clear display. The consumer pays a single price without knowing what portion of the distributed hydrogen comes from a decarbonized source. We recommend that buyers concerned about their carbon footprint inquire directly with the operator about the traceability of the distributed molecule.
- Gray hydrogen still largely dominates French production and maintains a low production price, but with a carbon footprint comparable to that of fossil fuels.
- Green hydrogen relies on the availability of competitively priced renewable electricity, which remains a limiting factor in many regions.
- Blue hydrogen (steam reforming with CO₂ capture) positions itself between the two, but capture infrastructures add a layer of complexity and additional cost.
The price trajectory will largely depend on the scaling up of renewable energy production and European regulations on quotas for decarbonized hydrogen in transportation.

Fuel Cell vs. Battery: The Real Cost Differential per Kilometer
The cost per kilometer of a hydrogen vehicle remains several times higher than that of a battery electric vehicle. The fuel cell converts hydrogen into electricity with an overall efficiency (production, compression, transport, conversion) significantly lower than the direct battery-electric motor cycle.
This energy efficiency differential is directly reflected in the bill. Where a battery electric vehicle consumes a few euros of electricity to travel several hundred kilometers, a hydrogen vehicle requires a much larger fuel budget for comparable range.
- The overall efficiency of the hydrogen chain (electrolysis, compression, transport, fuel cell) is around one-third of the initial energy effectively converted into movement.
- The battery chain (electricity production, charging, discharging, motor) retains a much larger share of the primary energy.
- The refueling time (a few minutes compared to several tens of minutes for a fast charge) remains the main operational advantage of hydrogen, especially for professional fleets and heavy vehicles.
Hydrogen mobility thus finds its relevance less in terms of cost than in terms of use: heavy vehicles, urban buses, high-turnover utility vehicles. For a private vehicle, the economic equation remains unfavorable in 2024. The documented fiasco of certain hydrogen bus fleets in France, amid recurring breakdowns and operational difficulties, illustrates that even professional uses are not immune to unexpected costs.
Refueling hydrogen in 2024 is expensive, not only because of the price per kilogram. The immaturity of the distribution network, the fixed costs of stations, and the pricing opacity between individuals and fleets weigh as much as the molecule itself. As long as the hydrogen vehicle fleet remains confidential, the actual cost of a full tank will not decrease significantly.